2024-01-20
Analyzing Heterogeneous Malware with angr
As an undergraduate researcher, I took part in a commissioned project for NSRI (applying symbolic execution to malware on heterogeneous platforms). The point was not a single platform but whether binaries written in many languages and runtimes (C, .NET/C#, Delphi, Go) — malware in particular — could be analyzed with symbolic execution.
Here I briefly cover the concept, then walk through the problems I actually hit per language. (The figures below are from my mid-term presentation.)
What is symbolic execution
Ordinary (concrete) execution follows a single path with concrete input. Symbolic execution instead treats input as a symbol and, as it walks the program, expresses each variable as a formula over that symbol. At each branch a path constraint accumulates, and at the end of a path a constraint solver solves them to work backwards to "what must the input be to reach this path?"
y = read();
z = y * 2;
if (z == 12) fail();   // reaching this branch requires y == 6
else         printf("OK");
Being able to automatically back-solve the input that drives execution to a buggy (or malicious) point is why symbolic execution is used for vulnerability and malware analysis. But since every branch forks the path, larger programs bring path/state explosion — and most problems in this project traced back to exactly that.
Surveying symbolic execution tools
I first surveyed which symbolic execution tools were usable per language/target. The representative ones:
| Tool | Target |
|---|---|
| angr | libVEX-based — x86, x86-64, ARM, AArch64, MIPS, MIPS64, PPC, PPC64, Java |
| Pex / IntelliTest | .NET Framework |
| KLEE | LLVM |
| S2E | x86, x86-64, ARM (user & kernel mode) |
| Manticore | x86-64, ARMv7, EVM |
| Symbolic PathFinder | Java bytecode |
| BINSEC | x86, ARM, RISC-V |
| Triton | x86, x86-64, ARM, AArch64 |
I took angr, which supports the widest range of ISAs, as the main tool and applied it to real binaries per language.
Analyzing C programs with angr
I started with native C binaries to get a feel. angr has two CFG analyses:
CFGFast— static; fast, but you can't specify a start address and the CFG gets very complex.CFGEmulated— dynamic; specify the start withstarts, keep execution state withkeep_state, and visit nodes to build a more accurate CFG.
I found main's address with IDA Pro and visualized with plot_cfg from angrutils.
import angr
from angrutils import plot_cfg

proj = angr.Project(binary_path, load_options={'auto_load_libs': True})
start_address = 0x00401100  # main address from IDA
cfg = proj.analyses.CFGEmulated(
    keep_state=True,
    starts=[start_address],
    initial_state=proj.factory.blank_state(),
)
plot_cfg(cfg, cfg_path, asminst=True, vexinst=False)
auto_load_libs: whether to auto-load shared libraries (no difference for this sample).asminst=True: show assembly in nodes (easier to read).vexinst=False: showing VEX IR too made nodes far too busy, so I left it off.
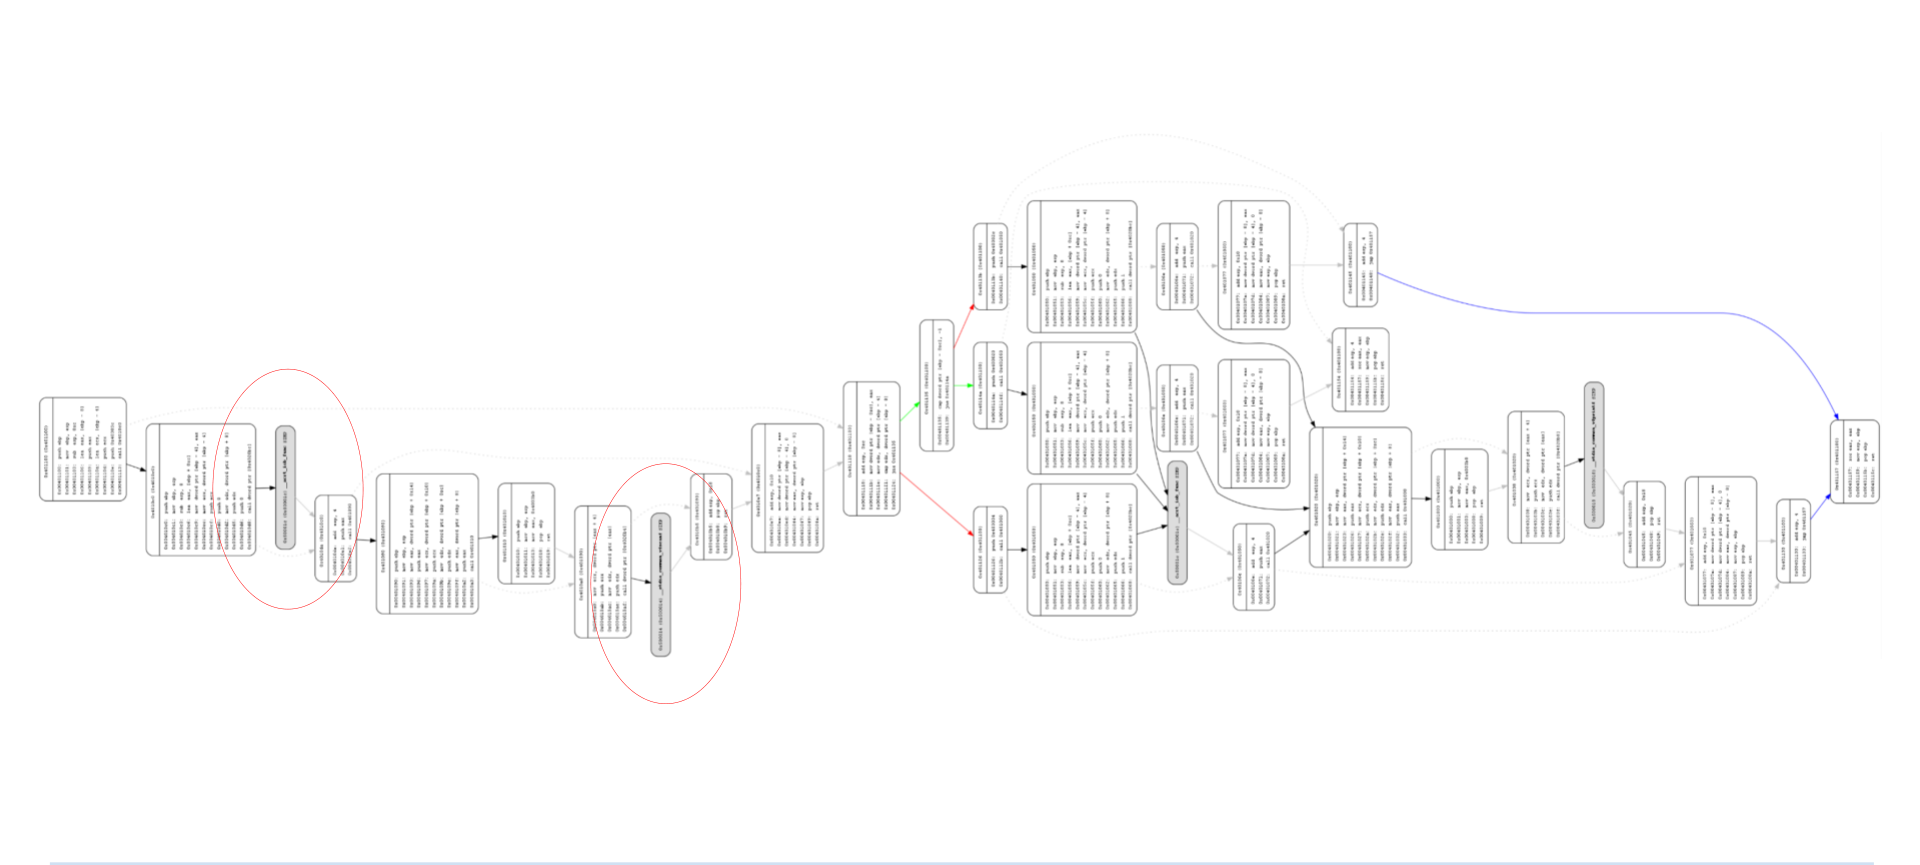 A C program's CFG built with angr
 CFGEmulated.
Native C is where angr is strongest, so extracting paths went smoothly. The friction started with the next step — languages with a heavy runtime.
PEX / IntelliTest (.NET)
Pex is a parameterized-unit-test input generator for .NET Framework programs, now integrated into Visual Studio Enterprise's IntelliTest. Using symbolic execution, it generates the minimal inputs that satisfy high coverage, along with their results (return value, exception message).
But Pex is a white-box testing tool — it needs source code, so it can't be used directly on source-less malware binaries. So I decompiled a .NET executable with dnSpy, moved it into Visual Studio, and ran Pex (IntelliTest). The decompiled result was very close to the original source, so the test itself worked — but only under the premise that the source can be recovered.
Delphi
Delphi binaries had a problem where IDA Pro failed to recognize some functions. Using IDR (Interactive Delphi Reconstructor) recognized more functions in some cases.
Analyzing a test program (print success on input 123, else wrong), I hooked readln
and iotest, and made a hook that stored a symbolic variable at the compared address
(0x00429CEC) to apply symbolic execution. The result showed something interesting.
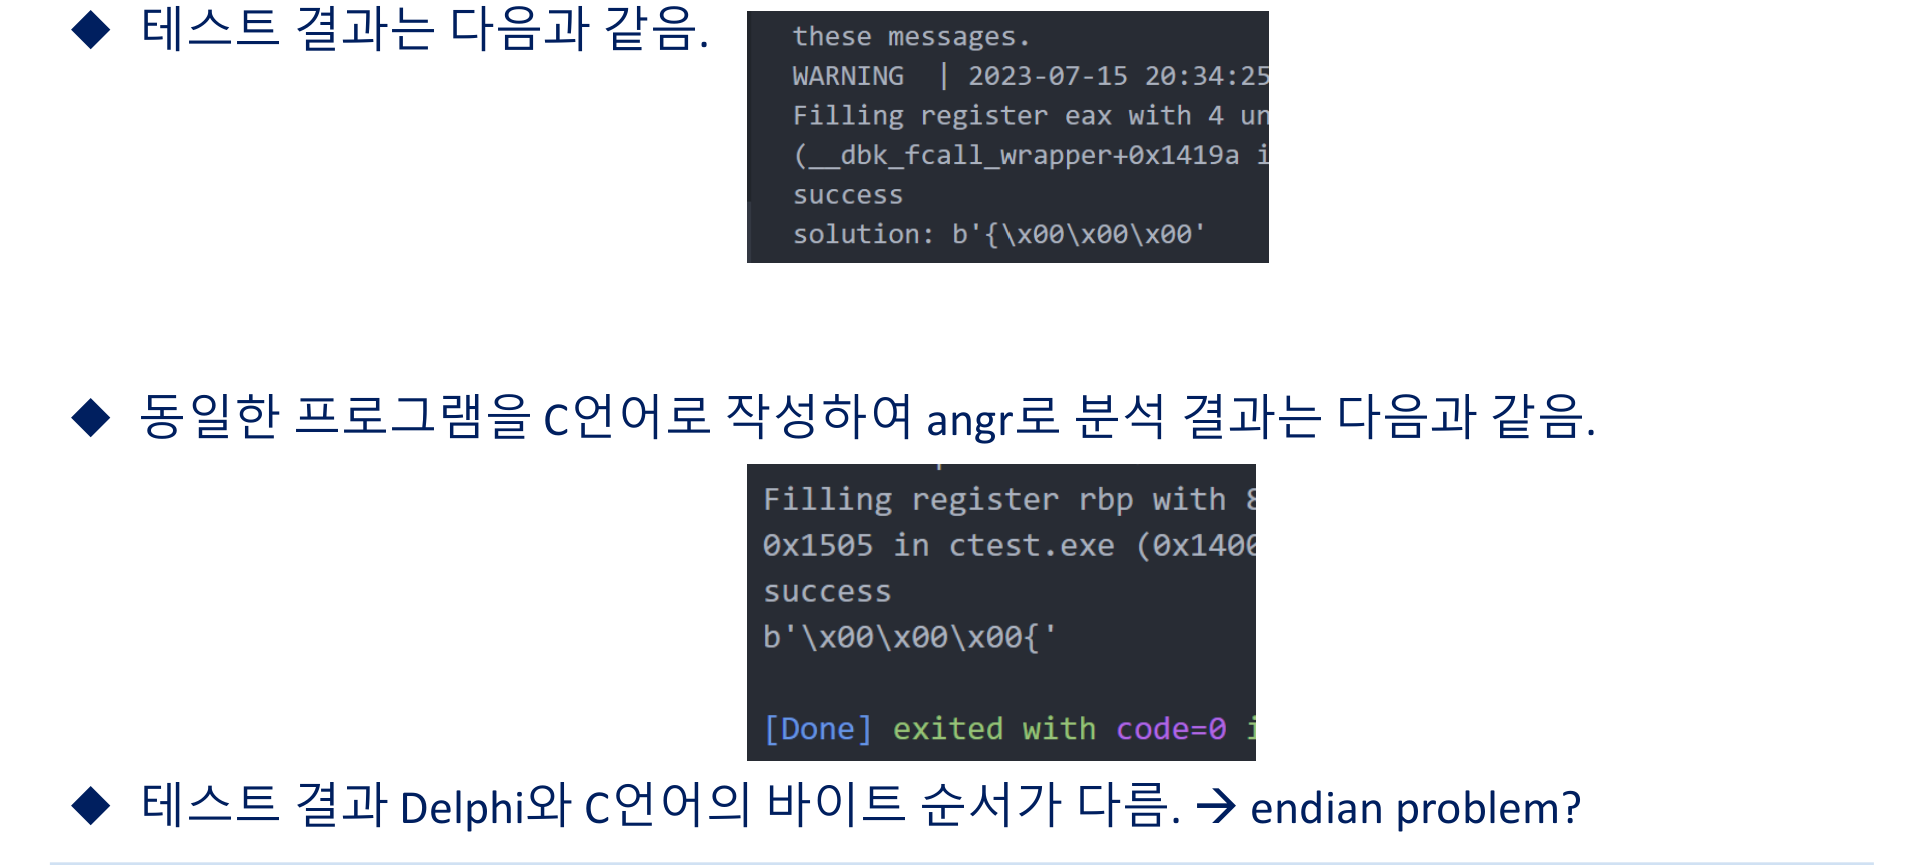 Solving the same logic written in Delphi vs. C with angr, the byte order of the solution differed.
Writing the same program in C and solving with angr, the byte order differed between Delphi and C (likely an endianness issue). Analyzing the real Delphi malware Micropsia, there weren't as many unrecognized functions as in the test program, and IDA Pro showed many WinAPIs — so implementing hooks for those WinAPIs looked likely to resolve much of it.
C# (.NET)
Compiling C# produces a .NET assembly (.exe/.dll) containing CIL (Common Intermediate
Language), which runs on the CLR and is turned into machine code by the JIT. So
opening it in IDA Pro shows CIL rather than native code, and even a trivial program shows
hundreds of functions (mostly sub_) with addresses hard to pin down.
Analyzing the real C# malware Quasar with angr, I looked at which APIs it used and hooked
them. After adding GetProcAddress and related APIs to the hooks, and hooking by address
instead of by function name, the error messages dropped from 43 to 16.
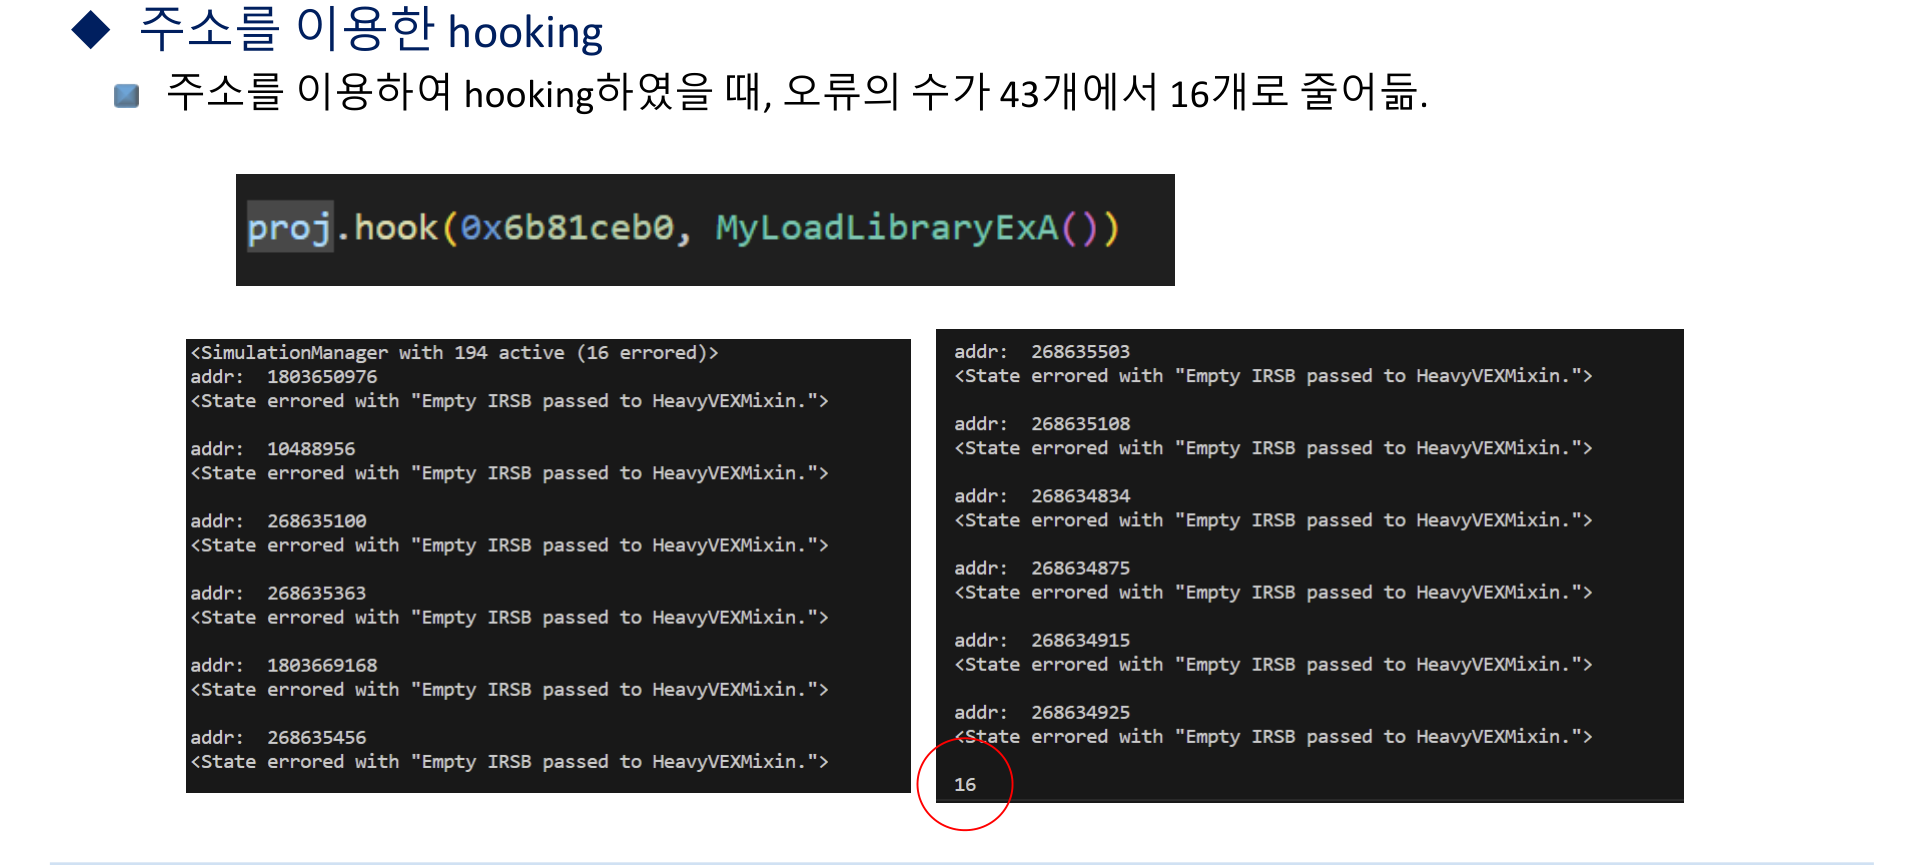 Hooking by address, e.g.
 proj.hook(0x6b81ceb0, MyLoadLibraryExA()), sharply cut the errored states.
But some problems never resolved:
- States were never added to the
SimulationManager'sdeadendedstash, so path exploration never terminated. - Once
activeexceeded ~500, VS Code was force-killed (memory). - From around 150
activestates, a SimState couldn't leave0x1002eb55; step-debugging showed an infinite loop jumping to the same address. Avoiding it let execution finish, but states still weren't added todeadended. - Most remaining warnings came from Windows/.NET runtime DLLs like
ntdll.dllandmscoree.dll.
C#'s problem wasn't the code logic — it was how to model the runtime and environment.
Golang
Go was the hardest in this project. A Go binary runs many runtime functions before
main(), and starting angr from the entry point, it couldn't get through that runtime to
reach main(), spewing only warnings.
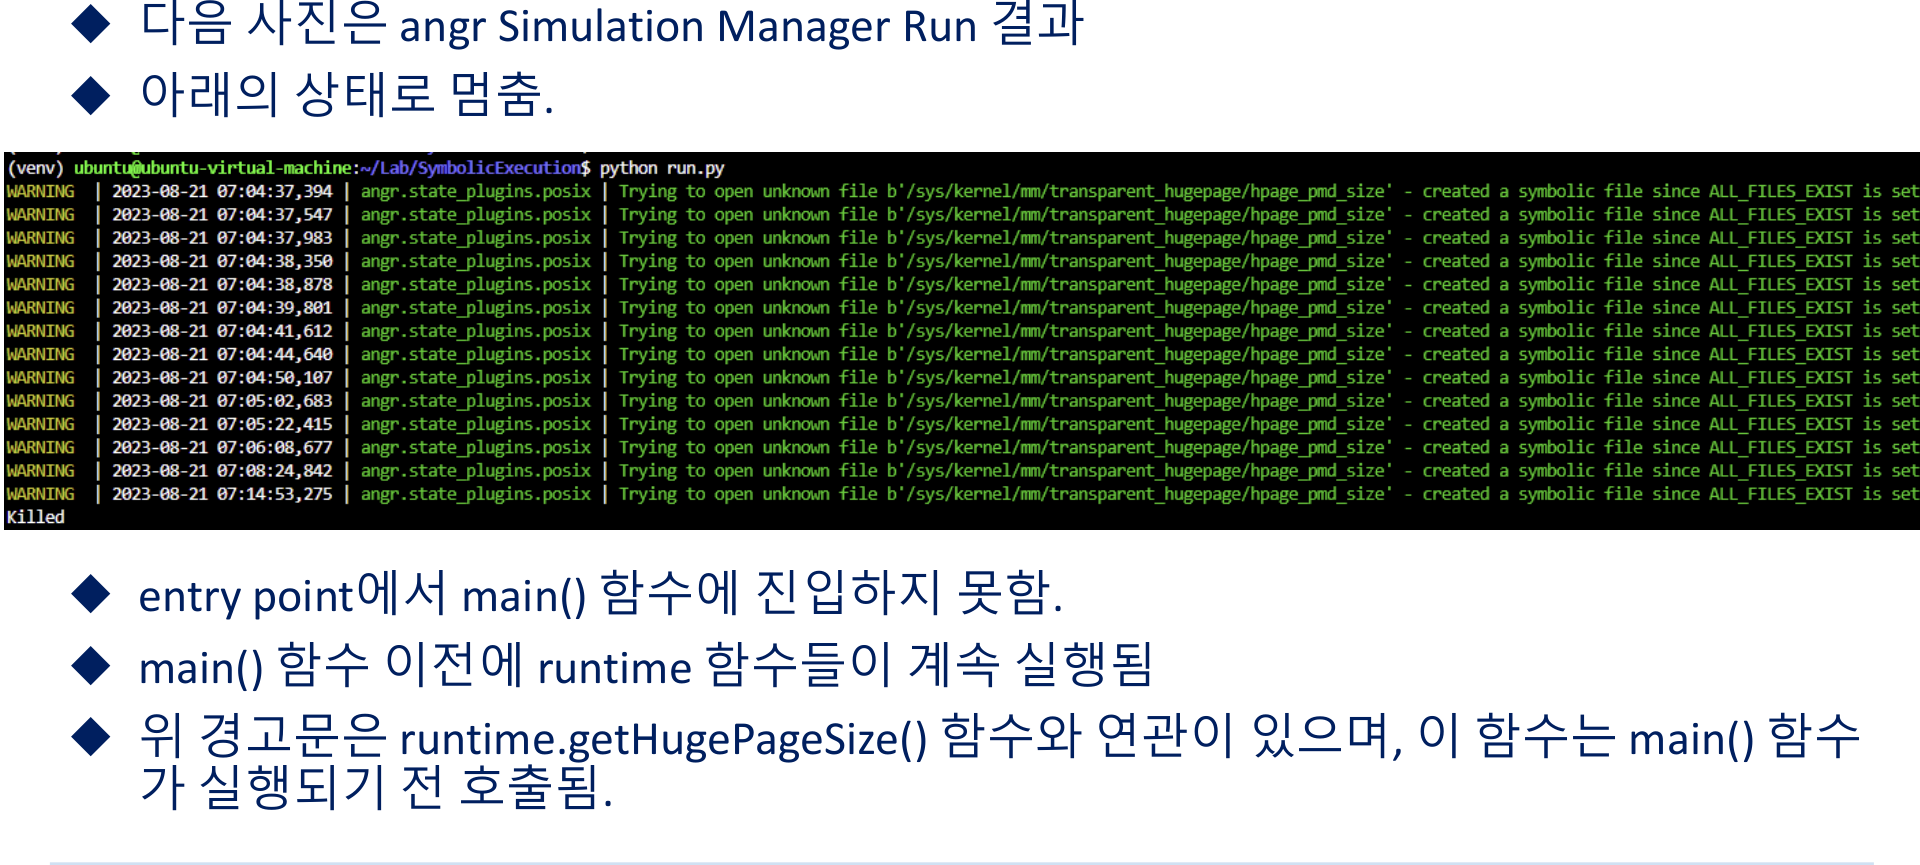 Stuck handling pre-main runtime (
runtime.getHugePageSize() etc.), repeating warnings until Killed.
My approach:
- Set the SimulationManager to start from
main()and hookedfmt.Fprintln. → It ran from main, but output handling stalled inruntime.printand the like. - Concluding I needed SimProcedures for the runtime, I implemented
newstacketc. as procedures. → With them, it ran without warnings, but produced so many states that the OS killed it for running out of RAM (state explosion) — so the procedure direction itself was valid. - I analyzed Go's startup flow (
osinit→schedinit…) and the GMP scheduler. The cycle where the stack is re-set up innewstackwas the source of the path explosion.
Here the fundamental limit showed. Most real Go programs use goroutines, which means the
Go scheduler (GMP: Goroutine, Machine, Processor, LRQ, GRQ) runs — and implementing that
scheduler as SimProcedures is very hard. Add libraries like net/http (struct differences
between Python's requests and Go's net package) and crypto, and the conclusion was that
applying symbolic execution to most Go malware as-is is difficult.
Symbion: interleaving concrete and symbolic
The recurring problem in C# and Go boils down to one thing — fully modeling the runtime/environment symbolically is too expensive. This is where I studied Symbion (concolic, concrete + symbolic interleaving).
Symbion alternates concrete execution and symbolic execution in angr. Hard-to-model regions (runtime init, unpacking, environment-dependent code) are run concretely on a real process attached via a debugger, and then that state is brought into an angr SimState to switch to symbolic exploration at the point of interest — synchronizing back to concrete if needed.
This was a practical way around the "pre-main runtime" and "runtime/environment DLL modeling" problems above: instead of solving everything symbolically, run the hard parts for real and hand only the analysis-worthy points to symbolic execution.
Limitations of Symbion
Symbion wasn't a silver bullet either.
- Running the concrete segment needs a real execution target attached via a debugger — you have to actually run and instrument the environment, which has a setup cost.
- Concrete execution follows only one path. To pass symbolic input into a concrete segment you must first concretize it, giving up path diversity for that segment.
- Malware's anti-debugging / anti-analysis can detect and disrupt the attached debugger (the concrete target).
- Decisively, the Windows environment was a problem. Symbion's concrete engine is avatar2/GDB-based and effectively Linux-centric, so attaching to a live Windows process to interleave concrete ↔ symbolic was awkward.
A Windows workaround: loading a process dump (DMP) into the angr state
For Windows binaries like C# and Delphi, Symbion's live concrete execution was hard to use. So instead of "live interleaving" I took a snapshot approach — run the process for real up to the point of interest, take a process memory dump (DMP) at that moment, and load that memory wholesale into an angr SimState. Starting symbolic execution from memory that already contains the real loaded DLLs, runtime, and heap meant I didn't have to model the whole Windows runtime/environment symbolically.
How to get a DMP
- Run the binary (or under a debugger) up to the point you want.
- In Task Manager, right-click the target process → Create dump file.
- Running under a debugger may show two processes; right-click → Properties and pick the one whose executable path matches.
Parsing with minidump
I parsed the dump with skelsec/minidump (a slightly
modified version). Install it from the minidump directory with python3 ./setup.py install;
if minidump.py doesn't run, try minidump.
Then I wrote a helper in parsing.py to copy dump memory into the angr state.
# read seg_size bytes at virtual address seg_addr from the dump and copy into the angr state
parse_dump(filename, seg_addr, seg_size, state)
The exact implementation is reconstructed from memory, but its role is clear — read a memory
region (virtual address seg_addr, size seg_size) from the DMP and write it into the angr
state at the same address. Roughly:
def parse_dump(filename, seg_addr, seg_size, state):
    md = MinidumpFile.parse(filename)            # load the dump
    reader = md.get_reader().get_buffered_reader()
    reader.move(seg_addr)                         # seek to the virtual address
    data = reader.read(seg_size)                  # read the real memory bytes
    state.memory.store(seg_addr, data)            # copy straight into the angr state
Filling in the needed segments this way lets angr carry the exact memory the real process had at that moment and continue symbolic execution from there — replacing Symbion's "pass through concretely" with a single memory snapshot.
Wrap-up
- angr was strong on native (C) binaries — from CFG extraction to path exploration.
- On managed / runtime-heavy languages (.NET/C#, Go), though, the real problem wasn't the code logic but how to model the runtime and environment — the CLR/DLLs for C#, the runtime and GMP scheduler for Go.
- Each language/runtime needed a mix of hooking, SimProcedures, and concolic (Symbion), and the fundamental problem I kept meeting was state explosion.